

-

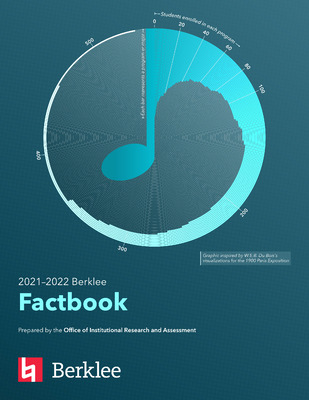
2021-2022 Berklee Factbook
Office of Institutional Research and Assessment
Welcome to the 2021–2022 Berklee Factbook. The factbook is released annually by the Office of Institutional Research and Assessment as an accessible resource for official Berklee statistics. I encourage you to engage with the data in the factbook and use it to expand your knowledge of the institution and inform decision-making and planning. Some items of note this year are increases in student enrollment in many areas (p. 24 ff), increased graduation rates (p. 59), and the addition of the first year of data on Berklee NYC. We continue an initiative begun last year that expands definitions of race, ethnicity, and gender to be more inclusive.
-

2020-2021 Berklee Factbook
Office of Institutional Research and Assessment
Welcome to the 2020-2021 Berklee Factbook. The factbook is released annually by the Office of Institutional Research and Assessment as an accessible resource for official Berklee statistics. As always, I encourage you to engage with the data in the factbook and use it to expand your knowledge of the institution and inform decision-making and planning. Several items to note this year: While the increasing overall enrollment trend of the past several years reversed this year due to the impact of Covid, this trend was not universal. Certain programs had steady enrollment and even increased enrollment compared to last year (see pages 25–52 for year-overyear trends), and Berklee Online showed record enrollment growth (page 29). I also invite you to view page five in the enrollment section, new this year, in which we expanded prior required definitions of race, ethnicity, and gender to be more inclusive.
-

2019-2020 Berklee Factbook
Office of Institutional Research and Assessment
Welcome to the 2019–2020 Berklee Factbook. This factbook has been designed by the Office of Institutional Research and Assessment as an accessible resource for official Berklee statistics. On the following pages, you will find valuable data on student enrollment, retention and graduation rates, faculty, staff, programming, tuition, and more. Gathered from many areas throughout the institution, data are shown for Berklee as a whole as well as for each legacy institution, where applicable and available. New this year is a page with information on PowerStation at BerkleeNYC. These data reflect information as of the fall 2019 semester, unless otherwise noted. Data and trends from previous years are also available.
-

2018-2019 Berklee Factbook
Office of Institutional Research and Assessment
Welcome to the 2018–2019 Berklee Factbook. This factbook has been designed by the Office of Institutional Research and Assessment as an accessible resource for official Berklee statistics.
On the following pages, you will find valuable data on student enrollment, retention and graduation rates, faculty, staff, programming, tuition, and more. Gathered from many areas throughout the institution, data are shown for Berklee as a whole as well as for each legacy institution, where applicable and available. These data reflect information as of the fall 2018 semester, unless otherwise noted. Data and trends from previous years are also available.
-

2017-2018 Berklee Factbook
Office of Institutional Research and Assessment
Welcome to the 2017–18 Berklee Factbook. This factbook has been designed by the Office of Institutional Research and Assessment as an accessible resource for official Berklee statistics.
In the following pages, you will find valuable data on students, faculty, staff, programming, and tuition. Gathered from many areas throughout the institution, data is shown for Berklee as a whole, as well as for each legacy institution where applicable and available. This data reflects information as of the fall 2017 semester, unless otherwise noted. Data and trends from previous years are available in the appendix.
Facts of particular note include a total student enrollment of over 6,700; a 29 percent international student population; three consecutive years of increased graduation rates; and information on the students in the First Year Abroad program. I encourage you to review the information in the factbook and refer back to it as needed. If you have any questions, please contact Institutional Research and Assessment at institutionalassessment@berklee.edu.
-

2016-2017 Berklee Factbook
Office of Institutional Research and Assessment
Welcome to the 2016-17 Berklee Factbook. This factbook has been created for ease of access and transparency to key information about Berklee. With the merger between Berklee College of Music and The Boston Conservatory and the expansion of existing programs, the Berklee community has grown. This factbook helps to outline what the new combined Berklee looks like, and provides information for each legacy institution as well as Berklee as a whole. In the following pages, you will find official statistics on Berklee’s students, faculty, staff, programming, and financial aid. Information was gathered from many areas throughout the institution. Data in the factbook, updated yearly, reflects information for the fall 2016 semester, unless otherwise noted. Facts of particular note include enrollment of nearly 6,000 students in undergraduate degree programs and over 400 in graduate programs; an increase in the graduation rate to 61%; and a strong student to faculty ratio of 10:1. I encourage you to review the information in the factbook and refer back to it as needed. If you have any questions, please contact Institutional Research and Assessment at institutionalassessment@berklee.edu.
Printing is not supported at the primary Gallery Thumbnail page. Please first navigate to a specific Image before printing.


